Soap Lake Conservancy meeting highlights challenges for lake health

The Soap Lake Conservancy had a special meeting June 28 bringing in officials from the Washington Department of Ecology, U.S. Bureau of Reclamation and Quincy-Columbia Basin Irrigation District. The meeting focused on the declining lake levels and the likely cause, lack of precipitation and less gains in net change.
NANCE BESTON/COLUMBIA BASIN HERALD

A discussion of lake levels was the subject of a special Soap Lake Conservancy meeting. From left to right, U.S. Bureau of Reclamation Ephrata Deputy Field Office Manager Clyde Lay, Washington Department of Ecology Eastern Region Contact Jaime Short, BOR Ephrata Field Office Manager Marc Maynard and Quincy-Columbia Basin Irrigation District Manager Roger Sonnichsen.
NANCE BESTON/COLUMBIA BASIN HERALD

The Soap Lake Senior Center was filled with people Saturday for a special Soap Lake Conservancy meeting. The meeting addressed the lowering of lake levels and the likely cause, lack of precipitation and less gains in net change.
NANCE BESTON/COLUMBIA BASIN HERALD
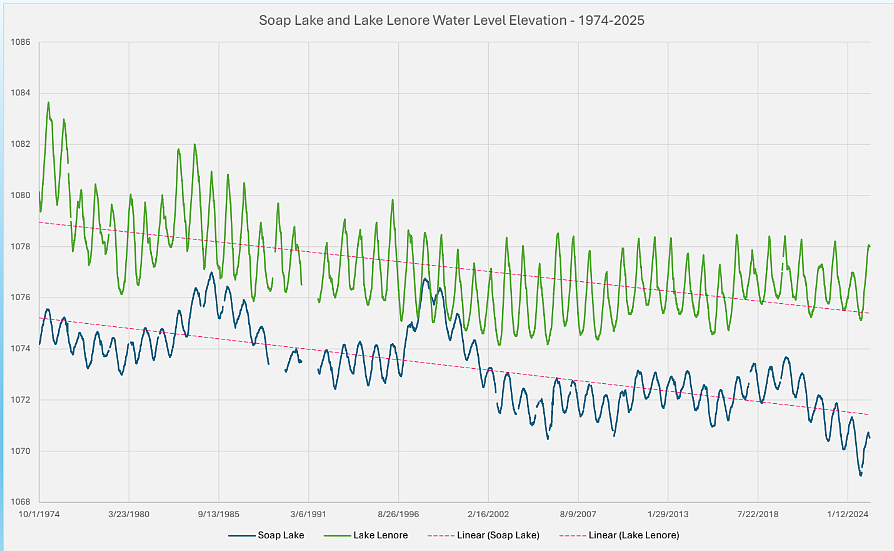
Soap Lake and Lake Lenore Water Levels from 1974 to 2025. The graph shows that when Lake Lenore drops in water levels, usually Soap Lake shows the same trend. As of the last five years, both have been showing a decrease in water levels.
SOURCES/WASHINGTON DEPARTMENT OF ECOLOGY, U.S. BUREAU OF RECLAMATION AND QUINCY-COLUMBIA BASIN IRRIGATION DISTRICT

The precipitation levels from the Ephrata Airport for the last 25 years. The last five years have shown below average precipitation which is impacting Soap Lake water levels.
SOURCES/WASHINGTON DEPARTMENT OF ECOLOGY, U.S. BUREAU OF RECLAMATION AND QUINCY-COLUMBIA BASIN IRRIGATION DISTRICT
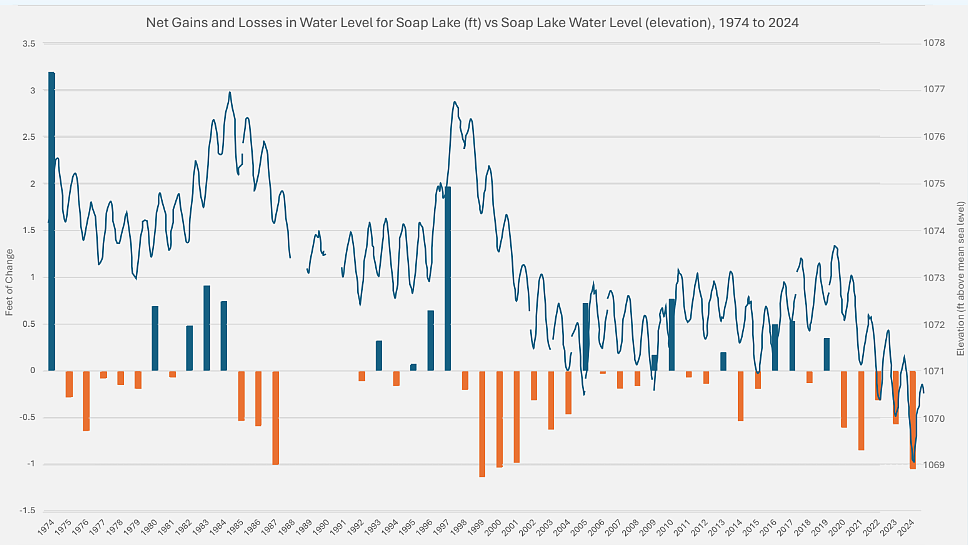
The net gains and losses in water level for Soap Lake versus the Soap Lake water elevation. Net change is the amount of precipitation gained in the wintertime and springtime compared to how much is lost in the summertime from evaporation and higher temperatures. The net change for Soap Lake has been showing more losses than gains for the past five years. Which aligns with the elevation of the lake, less gains result in lower lake levels.
SOURCES/WASHINGTON DEPARTMENT OF ECOLOGY, U.S. BUREAU OF RECLAMATION AND QUINCY-COLUMBIA BASIN IRRIGATION DISTRICT
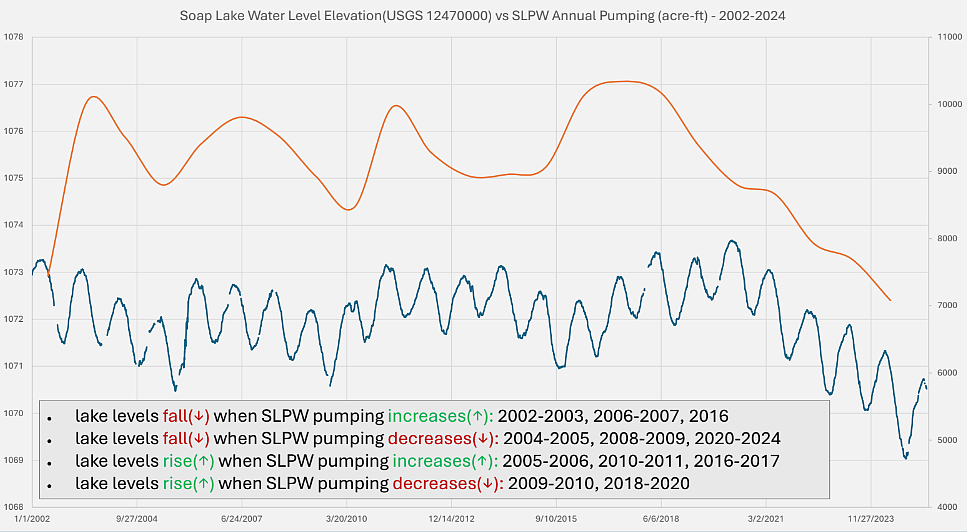
The Soap Lake water elevation compared to the Soap Lake Protective Works annual pumping. As the lake levels go down, pumping rates also decrease. The pumping has little to no impact on lake levels because the pumping rates are adjusted according to water levels.
SOURCES/WASHINGTON DEPARTMENT OF ECOLOGY, U.S. BUREAU OF RECLAMATION AND QUINCY-COLUMBIA BASIN IRRIGATION DISTRICT
Key points:
Soap Lake has seen a decrease in water levels over the past five years.
There has been lower-than-average precipitation for the past five years.
The net change for Soap Lake has been showing more losses than gains for the past five years. The loss ranged from 6 inches to 1 foot.
Soap Lake Protective Works manages the wells around the lake. The wells pull from the groundwater and as lake levels decrease, so do pumping rates.
The low lake levels are not caused by pumping from the wells. If the Soap Lake Protective Works ceased all pumping, groundwater would rise and flood basements in the city.
SOAP LAKE – The Soap Lake Conservancy held a special meeting Saturday to discuss Soap Lake water level trends. The meeting brought in experts from the Washington Department of Ecology, U.S. Bureau of Reclamation and Quincy-Columbia Basin Irrigation District.
“A couple of years ago, a few of the people in this room started calling the Department of Ecology with concerns,” DOE Eastern Region Contact Jaime Short said. “The lake level was going down. What's going on?”
Short explained that there were concerns around the irrigation project that DOE permitted. The DOE reached out to the BOR asking to pool information and data gathered on Soap Lake.
“The result is today, I will bring that information to you, share what we have and see,” Short said.
The four panelists discussed how the lake level has been receding since 2020, the lower-than-average precipitation data, Soap Lake protective works and the rate of pumping over the last few years.
Lake levels
Short confirmed that the lake levels have been receding since 2020, and each year since, the water levels have been getting lower.
“But this is definitely a low to the lake since 1974, so your eyes don't deceive you, especially if you've been in the area for a while,” Short said. “This is low.”
As of Jan. 12, 2024, the lake is sitting at around 1,069 feet above sea level. On Jan. 29 of 2013, the lake was at around 1,073 feet above sea level.
“This is the Soap Lake continuous elevation data, and it goes back to 1974 and comes to 2024,” Short said. “You can see there's been periods where it's lower, it jags up, comes down, jags up. But this is definitely low for the lake since 1974.”
Short then discussed water levels for Lake Lenore, which shows a similar trend. In 2013, Lake Lenore was sitting at around 1,078 feet above sea level, but as of Jan. 12, 2024, the lake is sitting at about 1,075 feet above sea level.
“The trend lines are identical. While Lake Lenore has had less of a larger ups and downs, it's actually the same trend. So, the variability, the rate is different, but the outcome is similar,” Short said.
Both Lake Lenore and Soap Lake have trend lines that show a steady decrease of lake water, with some peaks and valleys. The lines don’t match up exactly; however, they do follow the same general trend.
Lower precipitation
BOR Ephrata Deputy Field Office Manager Clyde Lay then talked about the precipitation levels the lake has been seeing over the past 25 years from the Ephrata Airport, which is the closest weather station to the lake.
“We can look at the period of time when the lake is gaining elevation in the spring and winter time, and through analysis of how much water is or how much water is being cost each year,” Lay said.
On average, Ephrata gets around 6.76 inches of rain a year, Lay explained. From 2014 to 2018, precipitation levels were above the average.
“There has been a very, very low amount of rain. You wouldn't know that we're in a desert with all the irrigation, but we do live in a desert, and the precipitation cycle is pretty variable,” he said.
However, for the past five years, there has been below-average precipitation. The only year that shows a different trend is 2023, which had almost 8 inches of precipitation. In 2019, 2021, 2022 and 2024, precipitation levels were under 6 inches. In 2020, there were almost 6.5 inches.
Net Change
Lay then went on to explain the net change of lake elevation, which compares how much the lake came up during the winter and spring versus how much it went down in the summer.
“That's pretty much driven by the hydrologic cycle, the rain and snow that we get in the spring, the summertime evaporation,” he said. “We're trying to look at, are we gaining more water in the wintertime, springtime or are we losing more water in the summertime?”
The graphic presented showed that since 2020, there has been more loss in water than gains in water, the lass has been ranging from around 6 inches to over one foot. 2024 showed the largest loss of recent years, with over a foot of change.
“The lake has been losing a lot of elevation during the summertime, and our average kind of uptick has been pretty low,” Lay said. “These last few years, when we've been losing a lot of lake elevation, it's been in the dry years. We've been having a lot of hotter, drier summers and cooler, drier winters. We haven't been getting the precipitation that we normally do.”
Lay said that since 1974, when the dataset begins, the lake periodically had some longer periods of drought and lake level changes.
The graph showed that from 1975 to 1979, losses ranged from around 6 inches. From 1980 to around 1984, there were gains in water of around a foot each year. From 1985 through 1987, there was more loss of water. From 1993 through 1987, there were more gains in water than losses. There was a seven-year period, beginning in 1998, when more water was lost. The loss and gains of water continue to flip-flop throughout the next 15 years until 2020, when the lake began to lose more water yearly.
“We're in another drop right now,” Lay said.
The next graphic then layered the lake levels on top of the net losses and gains, showing that water levels are higher when the gains are higher, and water levels are lower when the water losses are higher.
Protective works
Soap Lake Protective Works plays a crucial role for local wells in managing groundwater levels without impacting the fluctuating levels of Soap Lake itself, according to Roger Sonnichsen, QCBID manager.
The Soap Lake Protective Works consists of multiple pumping stations and wells located throughout the area. These include the FM and X wells near the high school, as well as the I, Y, and M wells in the park region. The Lake Lenore pump was turned off in 2020.
"The goal of protective works is to maintain groundwater levels while safely managing irrigation project waters," Sonnichsen said. "We’re essentially making sure our community remains safe from flooding by returning project water back to the lake."
Sonnichsen noted that the facilities work diligently to regulate groundwater levels by adjusting pumping rates as needed. Over the last three years, the total annual pumping has decreased, particularly due to the ongoing drought conditions affecting the region.
"Our systems are designed to maintain a set target groundwater level," he said. "As conditions change, particularly during droughts, our pumps automatically adjust to ensure that homes and local infrastructure are protected."
During the meeting, attendees were introduced to a data set illustrating the correlation between Soap Lake's elevation changes and the pumping volumes from the protective works.
"When the lake level drops, our pumping rates drop in tandem," Sonnichsen said.
He clarified that lower lake levels are not due to pumping.
When layered together, the data on lake levels and pumping rates demonstrated that when the lake level decreases, pumping rates do too, Sonnichsen said.
“If the protected works were affecting the lake, we would expect to see a different scenario,” he said. “You would expect to see pumping rates remaining static or possibly even increasing as you see the lake going down.”
 A discussion of lake levels was the subject of a special Soap Lake Conservancy meeting. From left to right, U.S. Bureau of Reclamation Ephrata Deputy Field Office Manager Clyde Lay, Washington Department of Ecology Eastern Region Contact Jaime Short, BOR Ephrata Field Office Manager Marc Maynard and Quincy-Columbia Basin Irrigation District Manager Roger Sonnichsen.
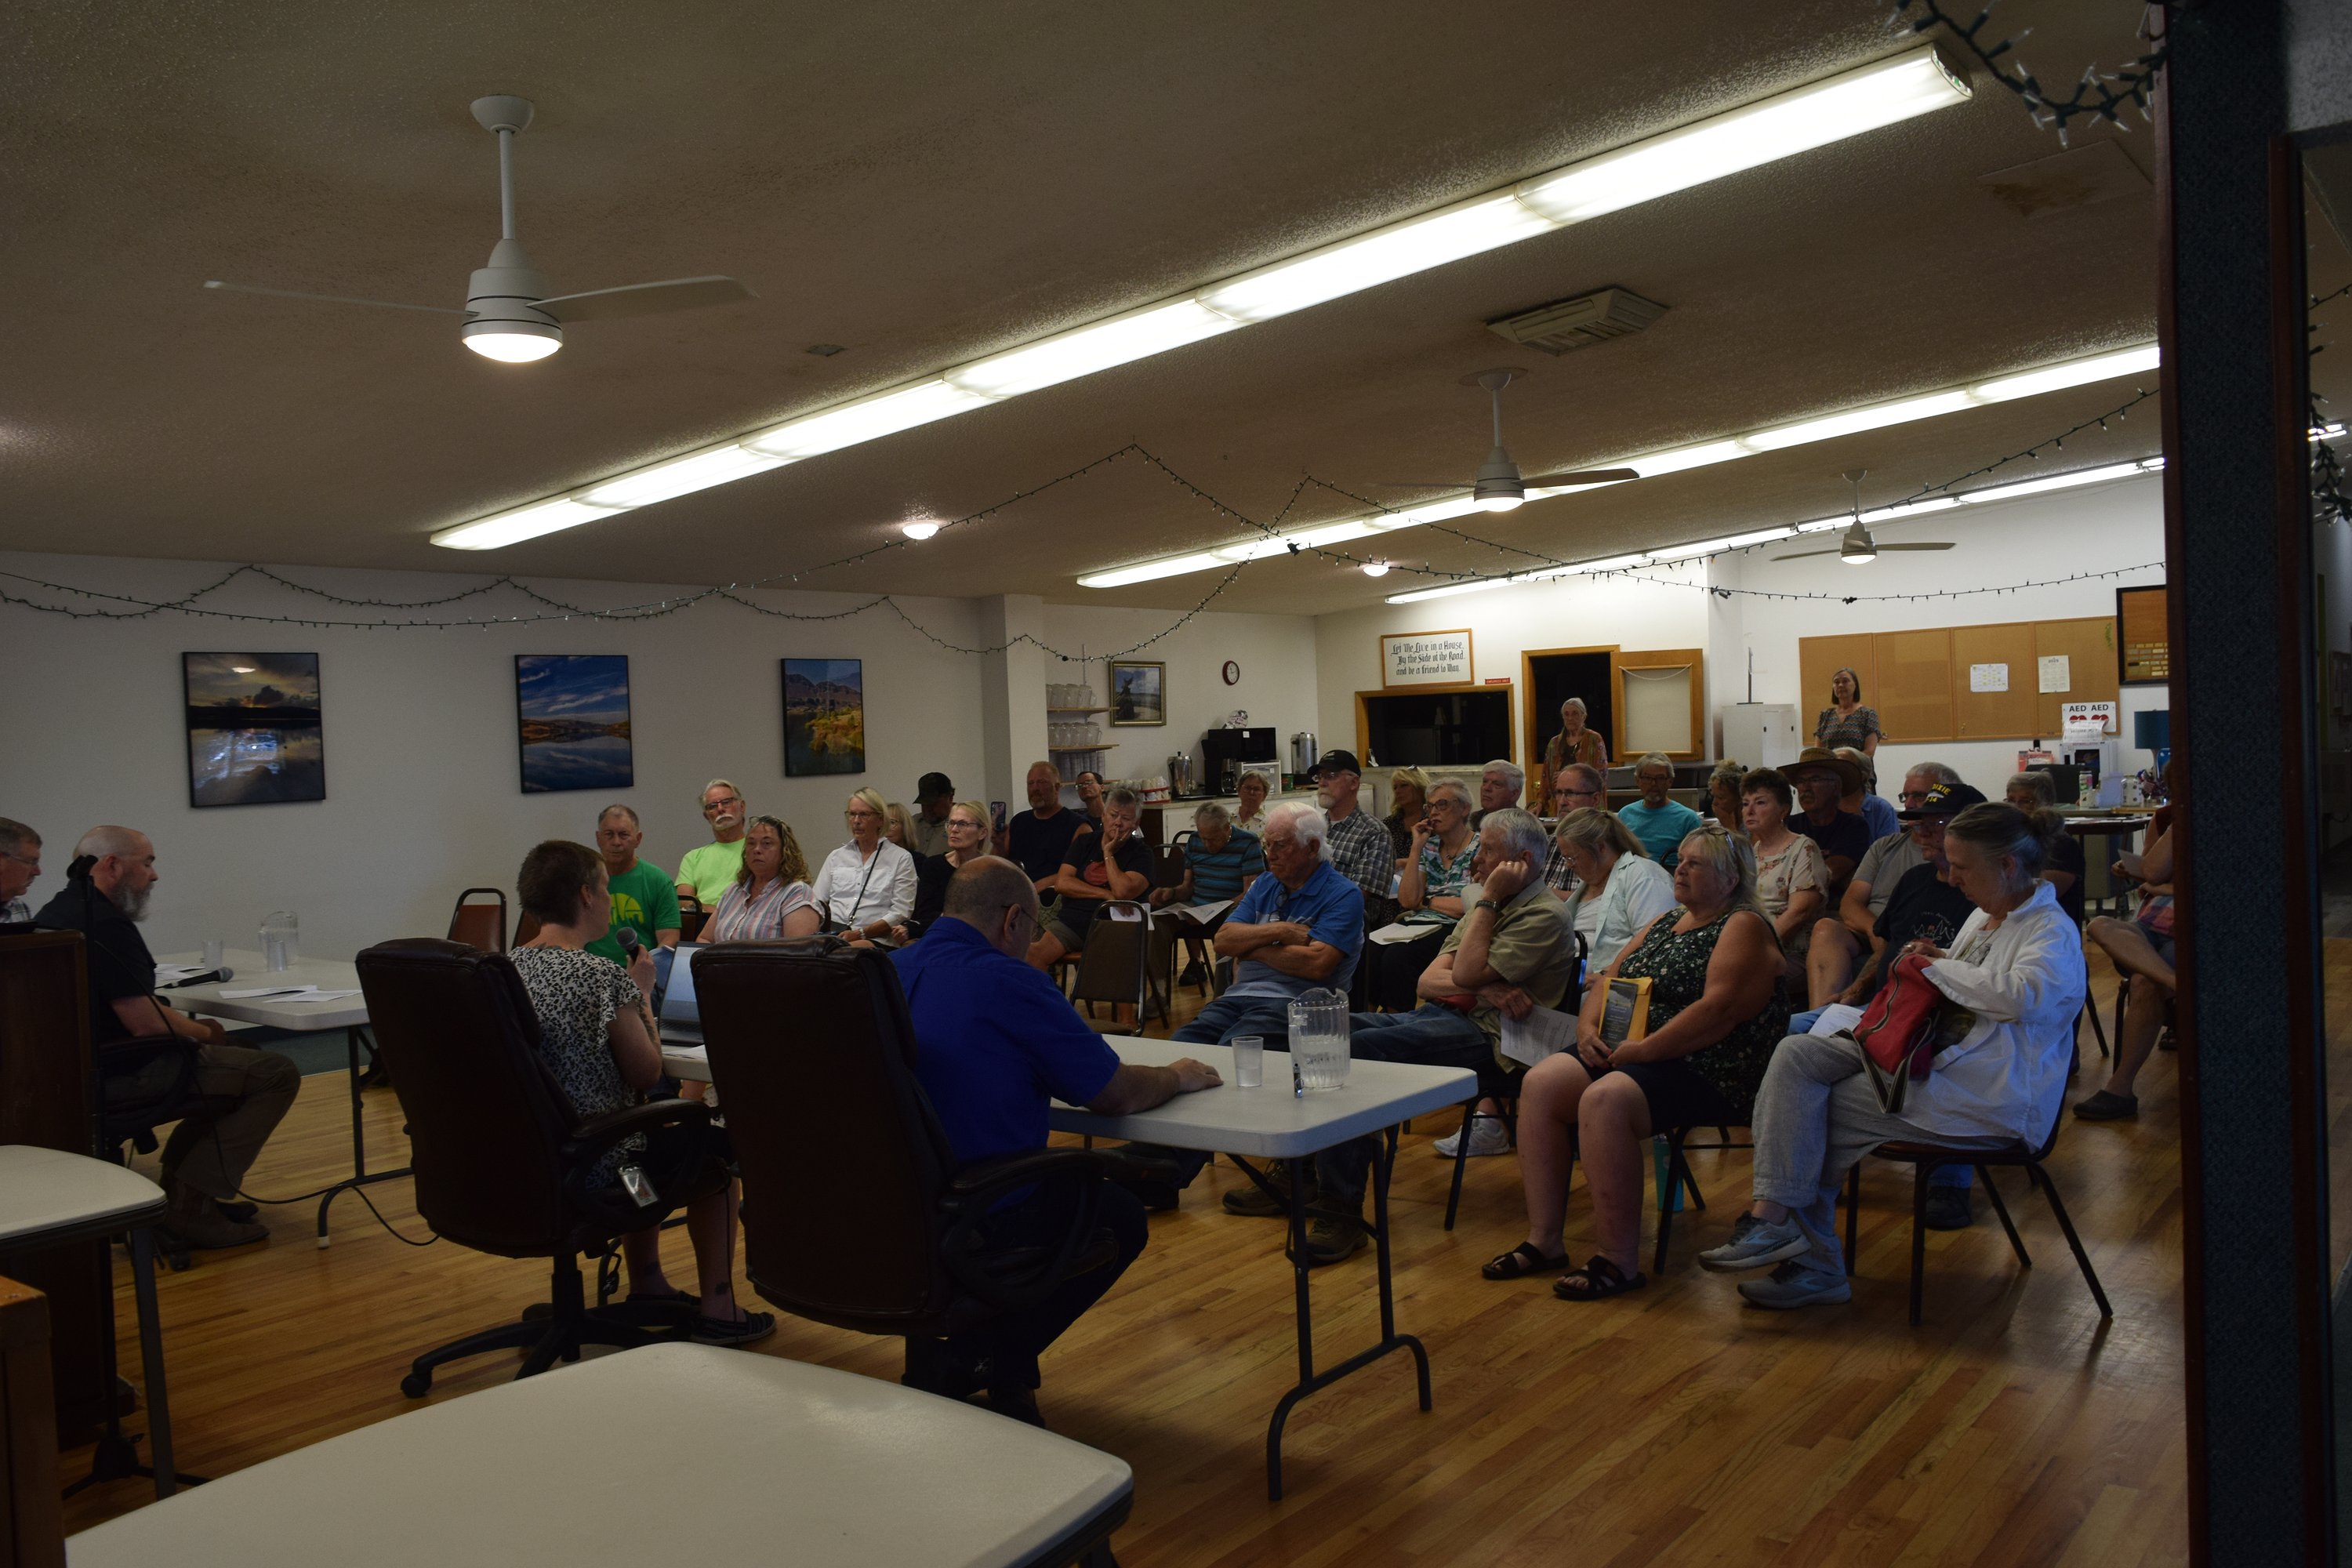 The Soap Lake Senior Center was filled with people Saturday for a special Soap Lake Conservancy meeting. The meeting addressed the lowering of lake levels and the likely cause, lack of precipitation and less gains in net change.
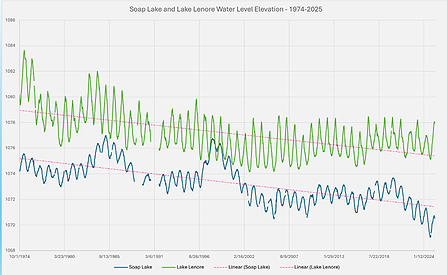 Soap Lake and Lake Lenore Water Levels from 1974 to 2025. The graph shows that when Lake Lenore drops in water levels, usually Soap Lake shows the same trend. As of the last five years, both have been showing a decrease in water levels.
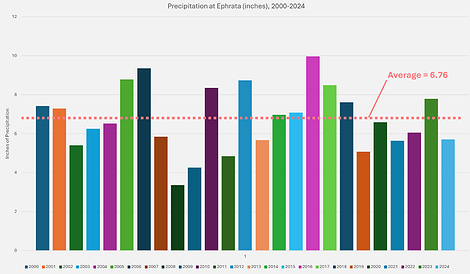 The precipitation levels from the Ephrata Airport for the last 25 years. The last five years have shown below average precipitation which is impacting Soap Lake water levels.
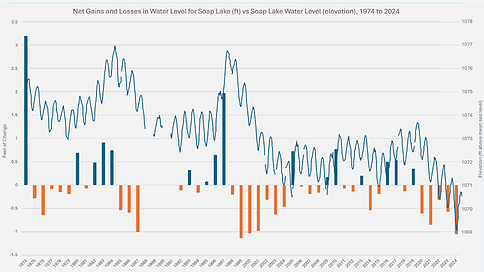 The net gains and losses in water level for Soap Lake versus the Soap Lake water elevation. Net change is the amount of precipitation gained in the wintertime and springtime compared to how much is lost in the summertime from evaporation and higher temperatures. The net change for Soap Lake has been showing more losses than gains for the past five years. Which aligns with the elevation of the lake, less gains result in lower lake levels.
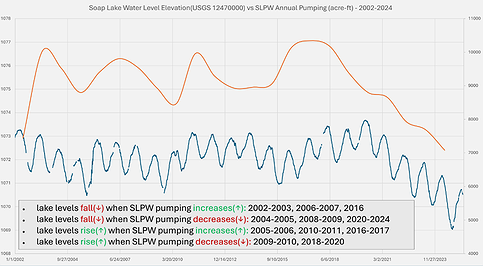 The Soap Lake water elevation compared to the Soap Lake Protective Works annual pumping. As the lake levels go down, pumping rates also decrease. The pumping has little to no impact on lake levels because the pumping rates are adjusted according to water levels.